Most drinkers underestimate what they spend on alcohol by 30-50%, and that’s just the direct cost. Once you include the secondary costs (Ubers home, late-night food, lost productivity, missed exercise, hangover-day takeaways), the actual annual spend is often double what people would estimate if asked. The numbers are not designed to make anyone feel bad. They’re just useful information for decisions about what trade-offs are worth it. This guide covers the full picture of what drinking costs, the specific patterns where the numbers get largest, and how to think about the math.
This is the pillar of our Cost of Drinking hub. Sub-articles will go deeper on specific angles (single-drink savings calculations, hidden costs, regional comparisons) as the hub fills out.
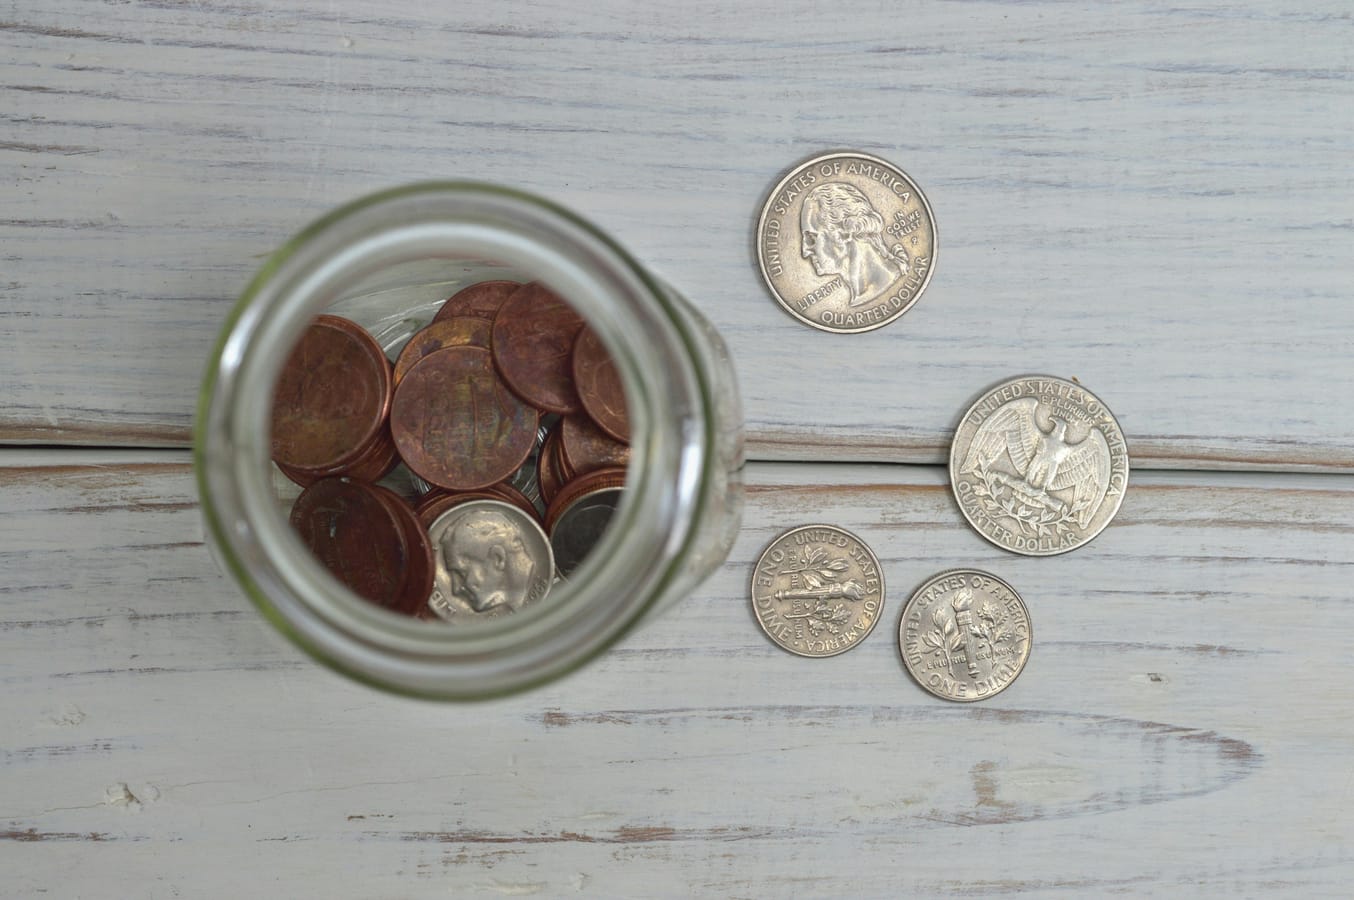
# The direct cost
The simplest math. Cost per drink times drinks per week times 52 weeks.
UK pub prices in 2026 typically run:
- Pint of standard lager: £5.50-7.00
- Pint of craft beer: £6.50-8.50
- 175ml glass of house wine: £7.00-9.00
- Bottle of house wine: £25-35
- Single spirit and mixer: £6.00-9.00
- Cocktail: £10-15
US bar prices in major cities run:
- Domestic beer: $7-9
- Craft beer: $8-12
- Glass of wine: $11-16
- Bottle of wine: $40-65
- Cocktail: $14-20
Australian pub prices in major cities run:
- Schooner of beer: AUD $10-14
- Glass of wine: AUD $11-16
- Cocktail: AUD $18-25
Home drinking is dramatically cheaper per unit:
- UK supermarket lager: £1.10-1.80 per 500ml can
- UK supermarket wine: £6-12 per 750ml bottle
- UK supermarket spirits: £18-28 per 700ml bottle
- US off-premise prices roughly 50-65% of bar prices for equivalent alcohol
- Australia roughly 50-60% of pub prices
The cost gap between pub and home drinking is one of the largest in any consumer category. A pint costs 3-5x more at the pub than the same alcohol from a supermarket.

# What “moderate” drinking actually costs
Plug specific patterns into the math. UK figures, GBP:
# Light drinker (4-6 drinks per week)
- 3 pints at the pub on Friday: £18 (£6 × 3)
- A bottle of wine at home over the week: £10
- Total weekly: £28
- Annual: £1,456
# Moderate drinker (10-14 drinks per week)
- 4 pints Friday after work: £24
- 4 pints Saturday lunch: £24
- 2 home wines through the week: £15
- Total weekly: £63
- Annual: £3,276
# Heavy drinker (20-25 drinks per week)
- 6 pints Friday: £36
- 6 pints Saturday: £36
- Bottle of wine each at dinner Friday: £15
- Bottle of wine Saturday afternoon: £12
- 2-3 home pours of spirits 4 nights a week: £8-10 weekly cost equivalent
- Total weekly: £107-110
- Annual: £5,564-£5,720
These numbers are direct alcohol cost only. They don’t include the secondary costs we’ll cover next.
# The pattern surprising most drinkers
Most people who would describe themselves as “moderate drinkers” are spending £2,500-3,500 a year on alcohol directly, plus another £1,500-2,500 in secondary costs. The total annual spend is often £4,000-6,000 a year on drinking-related expenses.
This is more than most people spend on annual holidays, energy bills, or vehicle running costs. It’s typically the third or fourth largest discretionary expense category in middle-income households where someone drinks regularly.
People are usually surprised by this. The drinks themselves don’t feel expensive in the moment; the cumulative spend is invisible without tracking.
# The hidden costs
The drinks themselves are the visible spend. Several categories of associated cost compound the total:
# Late-night food
The post-pub kebab, pizza, takeaway, or 24-hour McDonald’s. The drinking session disinhibits eating choices and adds 15-30 minutes of food spending that wouldn’t otherwise happen.
Typical addition: £8-15 per drinking session in the UK, $12-25 in the US. For someone drinking 2-3 sessions a week, that’s £80-180 a month, £960-2,160 a year just on drinking-driven late-night food.
# Transport
Ubers, taxis, trains home from sessions in city centers. Drinkers spend dramatically more on transport than non-drinkers because they can’t drive home from sessions, and because they often delay leaving until after public transport stops.
Typical addition: £15-30 per session for transport in UK cities, $20-40 in US cities. Annualized, this is often £1,500-3,000 a year.
# Hangover-day food
The recovery breakfast, the lazy-Sunday takeaway, the hungover takeaway dinner. Hangover days produce specific food preferences (high-fat, salty) and reduced cooking energy.
Typical addition: £10-20 per hangover day in the UK, $15-30 in the US. For someone with weekly hangover days, this is £520-1,040 annually.
# Reduced exercise
Hangover days mean missed gym sessions, missed long runs, missed planned activities. The cost is twofold: paying for memberships you’re not using fully, and missing the productivity benefits of exercise.
For a £40-60 monthly gym membership used 30% less because of hangovers: £150-200 of effective wasted spending per year, plus the indirect health cost.
# Lost productivity
Hangover days at work produce measurably reduced output. Studies estimate productivity at 30-60% of baseline on hangover days. For salaried workers, this isn’t a direct out-of-pocket cost, but it represents real economic value:
For a £40,000 salary worker with 50 hangover-impaired work days a year, the productivity loss represents roughly 5-7% of annual output. Whether this matters financially depends on whether your output is connected to your income (commission, freelance, business owners feel this directly; salaried workers feel it through promotion timing).
# Health costs
Direct healthcare spending related to drinking varies by country. In the UK with NHS coverage, individual cost is small. In the US with private insurance, drinking-related health issues drive measurable insurance and out-of-pocket spending.
Indirect health costs include longer-term spending on weight management, sleep aids, supplements taken to compensate for drinking effects, mental health support that’s at least partly addressing alcohol-driven symptoms.
# Premium pricing on alternatives
If you switch to alcohol-free options, the pricing in pubs and restaurants is often the same as alcoholic equivalents. The market hasn’t equalized; alcohol-free beer at the pub costs nearly as much as regular beer despite being cheaper to produce. Counter-intuitively, alcohol-free drinking at venues isn’t a substantial cost saver until you also reduce venue visits.

# The geography of drinking costs
The cost of drinking varies dramatically by location, even within the same country:
# UK regional variation
Pub prices in central London are 40-60% higher than equivalent pubs in northern England. A pint that’s £4.50 in Newcastle might be £7.50 in Soho. The same total drinking pattern produces dramatically different annual spend depending on where you do it.
# US regional variation
Bar prices in New York City, San Francisco, and Boston are 50-100% higher than equivalent bars in mid-tier cities. A craft beer that’s $7 in Pittsburgh might be $13 in Manhattan.
# Australian variation
Sydney and Melbourne are 30-50% more expensive than smaller cities. A pint that’s $9 in Adelaide might be $13-14 in central Sydney.
# Home vs venue ratio
The percentage of your drinking that happens at home versus venues massively affects total spend. Two people consuming the same alcohol can have 3-4x different annual spending depending on where they drink.
The pub-and-restaurant drinker spends £3,000-6,000 a year for what the home drinker spends £1,000-2,000 on. Same alcohol, very different financial impact.
# The travel premium
Holidays and city breaks usually involve elevated drinking spend. Resort destinations, all-inclusive packages, and tourist areas charge tourist premiums on drinks. A typical week’s holiday for moderate drinkers includes £200-400 in drinking-related spend that wouldn’t occur at home.
# The compounding cost
The annual cost is meaningful, but the multi-year compounded impact is where the numbers get genuinely large.
# Direct money compound interest
Money not spent on alcohol could be invested. £3,000 a year invested in a stock index fund (assuming ~7% historical returns) becomes:
- £3,000 saved for 1 year: £3,210
- £3,000 saved per year for 10 years: £41,449
- £3,000 saved per year for 20 years: £123,000+
- £3,000 saved per year for 30 years: £283,000+
The opportunity cost compounds substantially across a working lifetime. Someone choosing moderate drinking over a 30-year career is making a roughly £200,000-400,000 decision in real money terms.
This isn’t an argument that drinking is wrong. It’s just the actual math of what the trade-off involves. People making the trade-off knowingly and getting value from drinking are making informed decisions. People who haven’t done the math may be surprised.
# Health compound costs
Health-related costs of drinking accelerate non-linearly. Light drinking has minor health cost; moderate drinking has moderate cost; heavy drinking has substantial cost. The cumulative health spending difference between someone drinking 7 vs 14 vs 25 drinks per week becomes large over decades.
The biggest single financial implication is lifespan. Heavy drinking reduces life expectancy by 4-7 years on average; the cost of “what you would have done with those years” is hard to quantify but real.
# Career and earnings
People with drinking patterns that affect work performance experience slower promotion progress, fewer opportunities, and reduced lifetime earnings on average. The effect is small for moderate drinkers and substantial for heavy drinkers.
Studies estimating lifetime earnings difference between matched moderate and heavy drinkers find 5-15% lower lifetime earnings for the heavy drinking cohort, controlling for education and starting position.
# What does this mean practically
Several useful framings:
# Track the actual spend
Most drinkers don’t know their real annual alcohol cost. Tracking for 3 months and extrapolating is informative either way. Either you’re spending what you thought (good to confirm) or substantially more (good to know).
# Calculate the trade-off you’re making
If you’re spending £4,000 a year drinking, that’s £4,000 not going somewhere else. Holidays, paying down debt, savings, paying for childcare, learning a skill. Drinking might be worth it; the question is whether you’ve actively decided that or just defaulted.
# Look at the home vs venue ratio
Most people who reduce their alcohol cost without reducing total drinking do it by shifting more drinking to home and less to venues. The same drinks at supermarket prices vs pub prices produces a dramatically different annual spend.
# The reduction math
Cutting one drink a day saves more than people typically expect. We cover this specifically in What Cutting One Drink a Day Saves Over a Year.
# The long view
The lifetime opportunity cost of drinking is large. £3,000 a year for 30 years compounds to £200,000-400,000 in real wealth difference. This isn’t an argument against drinking, but it’s worth knowing what the trade-off involves.
# What this article isn’t
This article is not arguing you should quit drinking, drink less, or feel bad about how much you spend on alcohol. The numbers are just the numbers. People who spend money on drinking and get value from it are making valid choices.
The specific situations where the math becomes most relevant:
- People trying to save for specific goals (deposit, holiday, debt payoff) and looking for line items to reduce
- People rebuilding finances after life changes (divorce, redundancy, recession)
- People with drinking patterns that have escalated and want to assess the financial impact
- People comparing drinking to other discretionary spending categories
- People evaluating whether their drinking is producing value proportionate to its cost
For people who consciously decide that drinking is worth what they spend on it, the numbers are confirmation rather than challenge.
# How AlcoLog tracks drinking cost
AlcoLog logs each drink with a cost field. The default cost values come from the catalog (using typical UK prices); you can edit per drink for your local pricing or the specific venue.
The session-end summary shows total session cost alongside drinks, units, and calories. Over time, the History view’s monthly cards show monthly alcohol spend, and the Trend graph lets you select cost as the metric to track.
For people specifically interested in the spending question, the data lets you see annualized cost based on your actual pattern, compared to whatever savings or investment goals you’re working on.
The CSV export (last 10 sessions Free, unlimited Pro) gives you raw data you can drop into a spreadsheet for more detailed analysis.