The variables that actually predict hangover severity are well-known: total volume, pace of drinking, hydration during the session, drink choice, and stopping time. The honest mechanism for reducing hangovers is making those variables visible while you’re drinking, not after. AlcoLog is built around making this practical: the data is in front of you live, alerts fire when you cross thresholds you’ve set, and the patterns become visible over time. This article is part of our Hangovers hub, the complete guide to preventing and recovering from a hangover.
This article explains the specific AlcoLog features that help with hangover prevention, and the ones that genuinely don’t (we won’t oversell what the app does).
# The variables that matter
We covered the science properly in The Science of a Hangover. The short version of what affects hangover severity, ranked by impact:
- Total alcohol consumed (biggest factor)
- Pace of consumption (faster equals worse)
- Hydration during and after (real but second-tier)
- Drink choice (low-congener beats high-congener)
- Stopping time before bed (2-3 hours buffer matters)
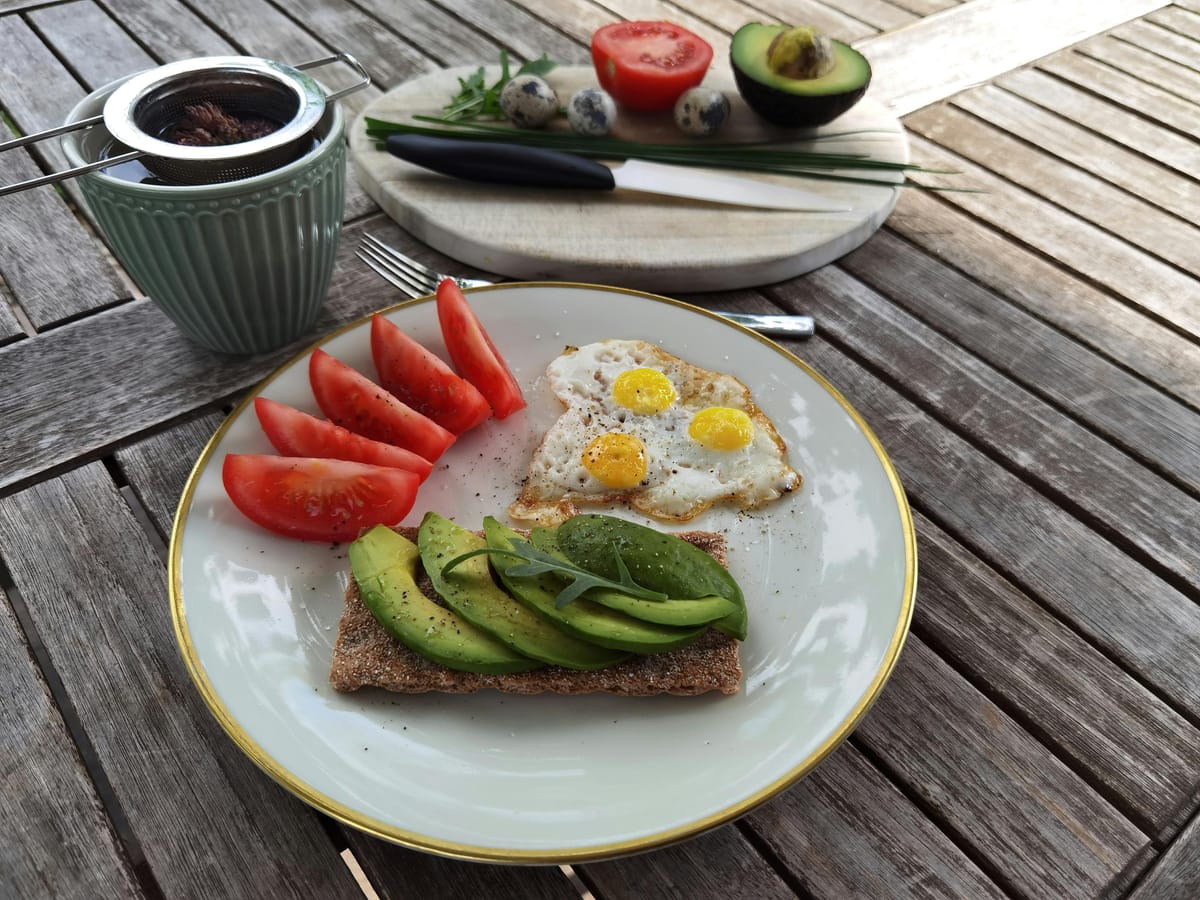
- Food in your stomach (slows absorption)
A drinks tracker can directly affect 1, 2, 3, and 5 by surfacing the right information at the right time. It doesn’t change drink choice or whether you ate. The features that matter for hangover prevention are the ones that act on the variables you can change mid-session.
# Live volume tracking
Every drink logs in one tap. The session header shows running totals: drinks, units, calories, cost, all updated as you go. The stat line is visible whenever you have the app open, and it appears on the lock screen Live Activity, Dynamic Island, and home screen widgets if you’ve added them.
Why this matters for hangovers: people consistently underestimate how much they’ve drunk. A 2018 study (Research Society on Alcoholism) found drinkers underestimated their drinking by 30-50% when asked to recall a session afterwards. Live tracking removes the recall problem; you see the actual number now, not your estimate later.
The most common moment this catches people: glance at the app, realize you’ve had 6 drinks not 3, decide to slow down or stop. That single decision moment is where most of the hangover-prevention value lives.

# Drinks-per-hour pacing visibility
The session timeline chart shows each drink as a colored bar at the time it was logged. Looking at the chart at any point in a session shows you the gap between drinks. A session with bars closely clustered shows fast drinking; a session with bars spread out shows steady pace.
Why this matters for hangovers: pace produces hangover severity beyond what total volume alone predicts. Five drinks in 90 minutes produces a worse hangover than five drinks in 4 hours, because peak blood alcohol is higher and the liver gets more behind on processing.
The chart doesn’t tell you to slow down; it shows you whether you’re drinking faster than you intended. Most people who look at their own pacing realize it’s faster than they remembered, and adjust. This is one of the more reliable hangover-reduction interventions, and it doesn’t require any willpower beyond looking at the screen.
# The hydration reminder
In Settings, the Hydration reminder can fire by time interval, by drink count, or both. Set it to remind you every 30 minutes, or every drink, or every 2 drinks, or whatever cadence fits your normal session pattern.
When the reminder fires, you log a water in the same one-tap flow as any other drink. Water shows on the session timeline alongside alcoholic drinks, so at the end of the session you can see the actual water-to-alcohol ratio you maintained.
Why this matters for hangovers: hydration during the session reduces the dehydration component of a hangover, and the actual mechanism is partly that the water slows your overall pace (we covered the chemistry in The Drink Water Between Drinks Rule). Just having the reminder fire prompts the behavior. People who set the reminder reliably drink more water alongside than people who don’t.
# Consumption alerts at the threshold you set
Set a units threshold (Free) or drinks, calories, or cost thresholds (Pro). When you cross your set threshold, an alert fires as both a notification and an in-app system alert.
The auto-raise option is interesting: when you breach a threshold, the alert can offer to raise the limit by a custom percentage (5-100% in 5% steps, Pro feature). This is honest about what most people actually do: when they’re already over their limit, they’re not going to stop. Better to bump the limit visibly and see the pattern than to suppress an alert and pretend it didn’t fire.
Why this matters for hangovers: knowing your “this is where the hangover starts being noticeable” threshold and getting an alert when you reach it puts the decision in front of you while you’re drinking. The alert doesn’t stop you. It marks the moment.
# Session-end summary
When you tap End Session, the summary shows the full session: total drinks, drinks per hour, peak pace, total units, total calories, total cost, water logged, time spent, and any alerts that fired during the session.
Why this matters for hangovers: the session that produced last week’s bad hangover and this week’s manageable one will have measurable differences. Looking at both summaries, you can see what differed: pace, total volume, water ratio, end time. The pattern that produces milder hangovers becomes visible.
# The History view’s calendar heatmap
Over time, the History view shows monthly cards with sessions/drinks/units/calories/cost per month, plus a calendar heatmap that colors each day by intensity. Sessions are visible at a glance.
Why this matters for hangovers: the pattern of drinking days versus rest days affects hangover frequency and severity. Many drinkers think they have “occasional” sessions when the heatmap reveals consecutive-night patterns or weekend-spanning patterns. Seeing the actual rhythm helps with the spacing decisions that affect hangover recovery.
The sober streak visualization shows runs of consecutive sober days. This isn’t a hangover prevention feature exactly, but rest days between sessions are one of the few things that genuinely reduce cumulative hangover damage.

# The AlcoScore Recovery pillar
AlcoScore is a 0-100 health score across six pillars (frequency 25%, intensity 25%, trend 20%, control 10%, behavior 10%, recovery 10%). The Recovery pillar specifically factors in your rest days between sessions.
Why this matters for hangovers: hangovers compound across consecutive drinking nights. The Recovery pillar makes the rest-day pattern visible as part of your overall score. For people who think “I drink moderately” but actually drink most days, the Recovery pillar will be among the lowest-scoring pillars, prompting reflection on the spacing question.
A few caveats on AlcoScore relevant to hangovers:
- Medications are deliberately excluded from scoring. This is a privacy and design choice; AlcoScore isn’t a medical assessment.
- The score updates at session end, not in real time during sessions
- It uses a rolling 28-day window, so it reflects recent patterns rather than absolutes
- It unlocks after 5 sessions across 3 different days, so brand new users see a “Building Score” state until they accumulate enough data
# What AlcoLog deliberately doesn’t do
Worth being explicit about features that don’t exist, because we’d rather not oversell:
No AI hangover predictions. No model says “you’re likely to feel awful tomorrow.” The data is yours to interpret.
No medication-aware scoring. Medication doses you log do not affect AlcoScore by design. People taking naltrexone or other alcohol medications can log them on a separate flow, but those entries stay out of the score calculation. We covered this design choice in our Naltrexone hub.
No nag-mode. The app won’t lecture you about your drinking. Alerts fire on thresholds you set; reminders fire on schedules you set. The app stays out of your way unless you’ve configured it to do otherwise.
No social sharing of drinking data. No leaderboards, no posting your sessions, no comparison with friends. Your drinking is your business.
No automatic drink ID from photos as a primary feature. The Photo Recognition feature on the Add Drink screen is a convenience for identifying a drink type from an image; it doesn’t auto-log without your confirmation.
No account, login, or sync to a server. Everything stays on the device. CSV export (last 10 sessions Free, unlimited Pro) is the way to back up or share your data, on your terms.
# What this looks like in practice
A typical hangover-conscious session with AlcoLog might look like:
- Tap Start Session before the first drink
- Log each drink as you have it (one tap from favorites, two taps for new drinks)
- Hydration reminder fires every 2 drinks; you log a water alongside
- Glance at session stats around drink 4: 4 drinks, 9.5 units, 380 calories, 60 minutes elapsed. Pace is sustainable.
- Drink 6 hits at 90 minutes. The consumption alert fires (units threshold of 12 reached). You decide to slow down or shift to water.
- Final drink logged at 23:00. End Session at 23:30 to lock the totals.
- The session summary shows: 8 drinks, 18 units, 650 calories, 480 minutes, 4 waters logged, drinks-per-hour averaging 1.
Sunday morning, the History view’s calendar shows Saturday’s session as moderate-intensity. AlcoScore Recovery pillar is healthy because you spaced this session 4 days from the previous one. The session-end summary tells you what produced the morning you’re having.
The app doesn’t prevent the hangover. It makes the variables that produce it visible enough that you can adjust over time.